Lepus ships a Rack-based monitoring UI showing consumer status, throughput, and recent activity.
Running it standalone
bundle exec lepus web --port 9292 --host 0.0.0.0Visit http://localhost:9292.
Mounting in Rails
require 'lepus/web'
authenticate :user, ->(u) { u.admin? } do  mount Lepus::Web::App, at: '/lepus'end
Or with Devise:
authenticate :admin_user do mount Lepus::Web::App, at: '/admin/lepus'endImportant: the dashboard has no built-in auth. Wrap it with whatever your app already uses.
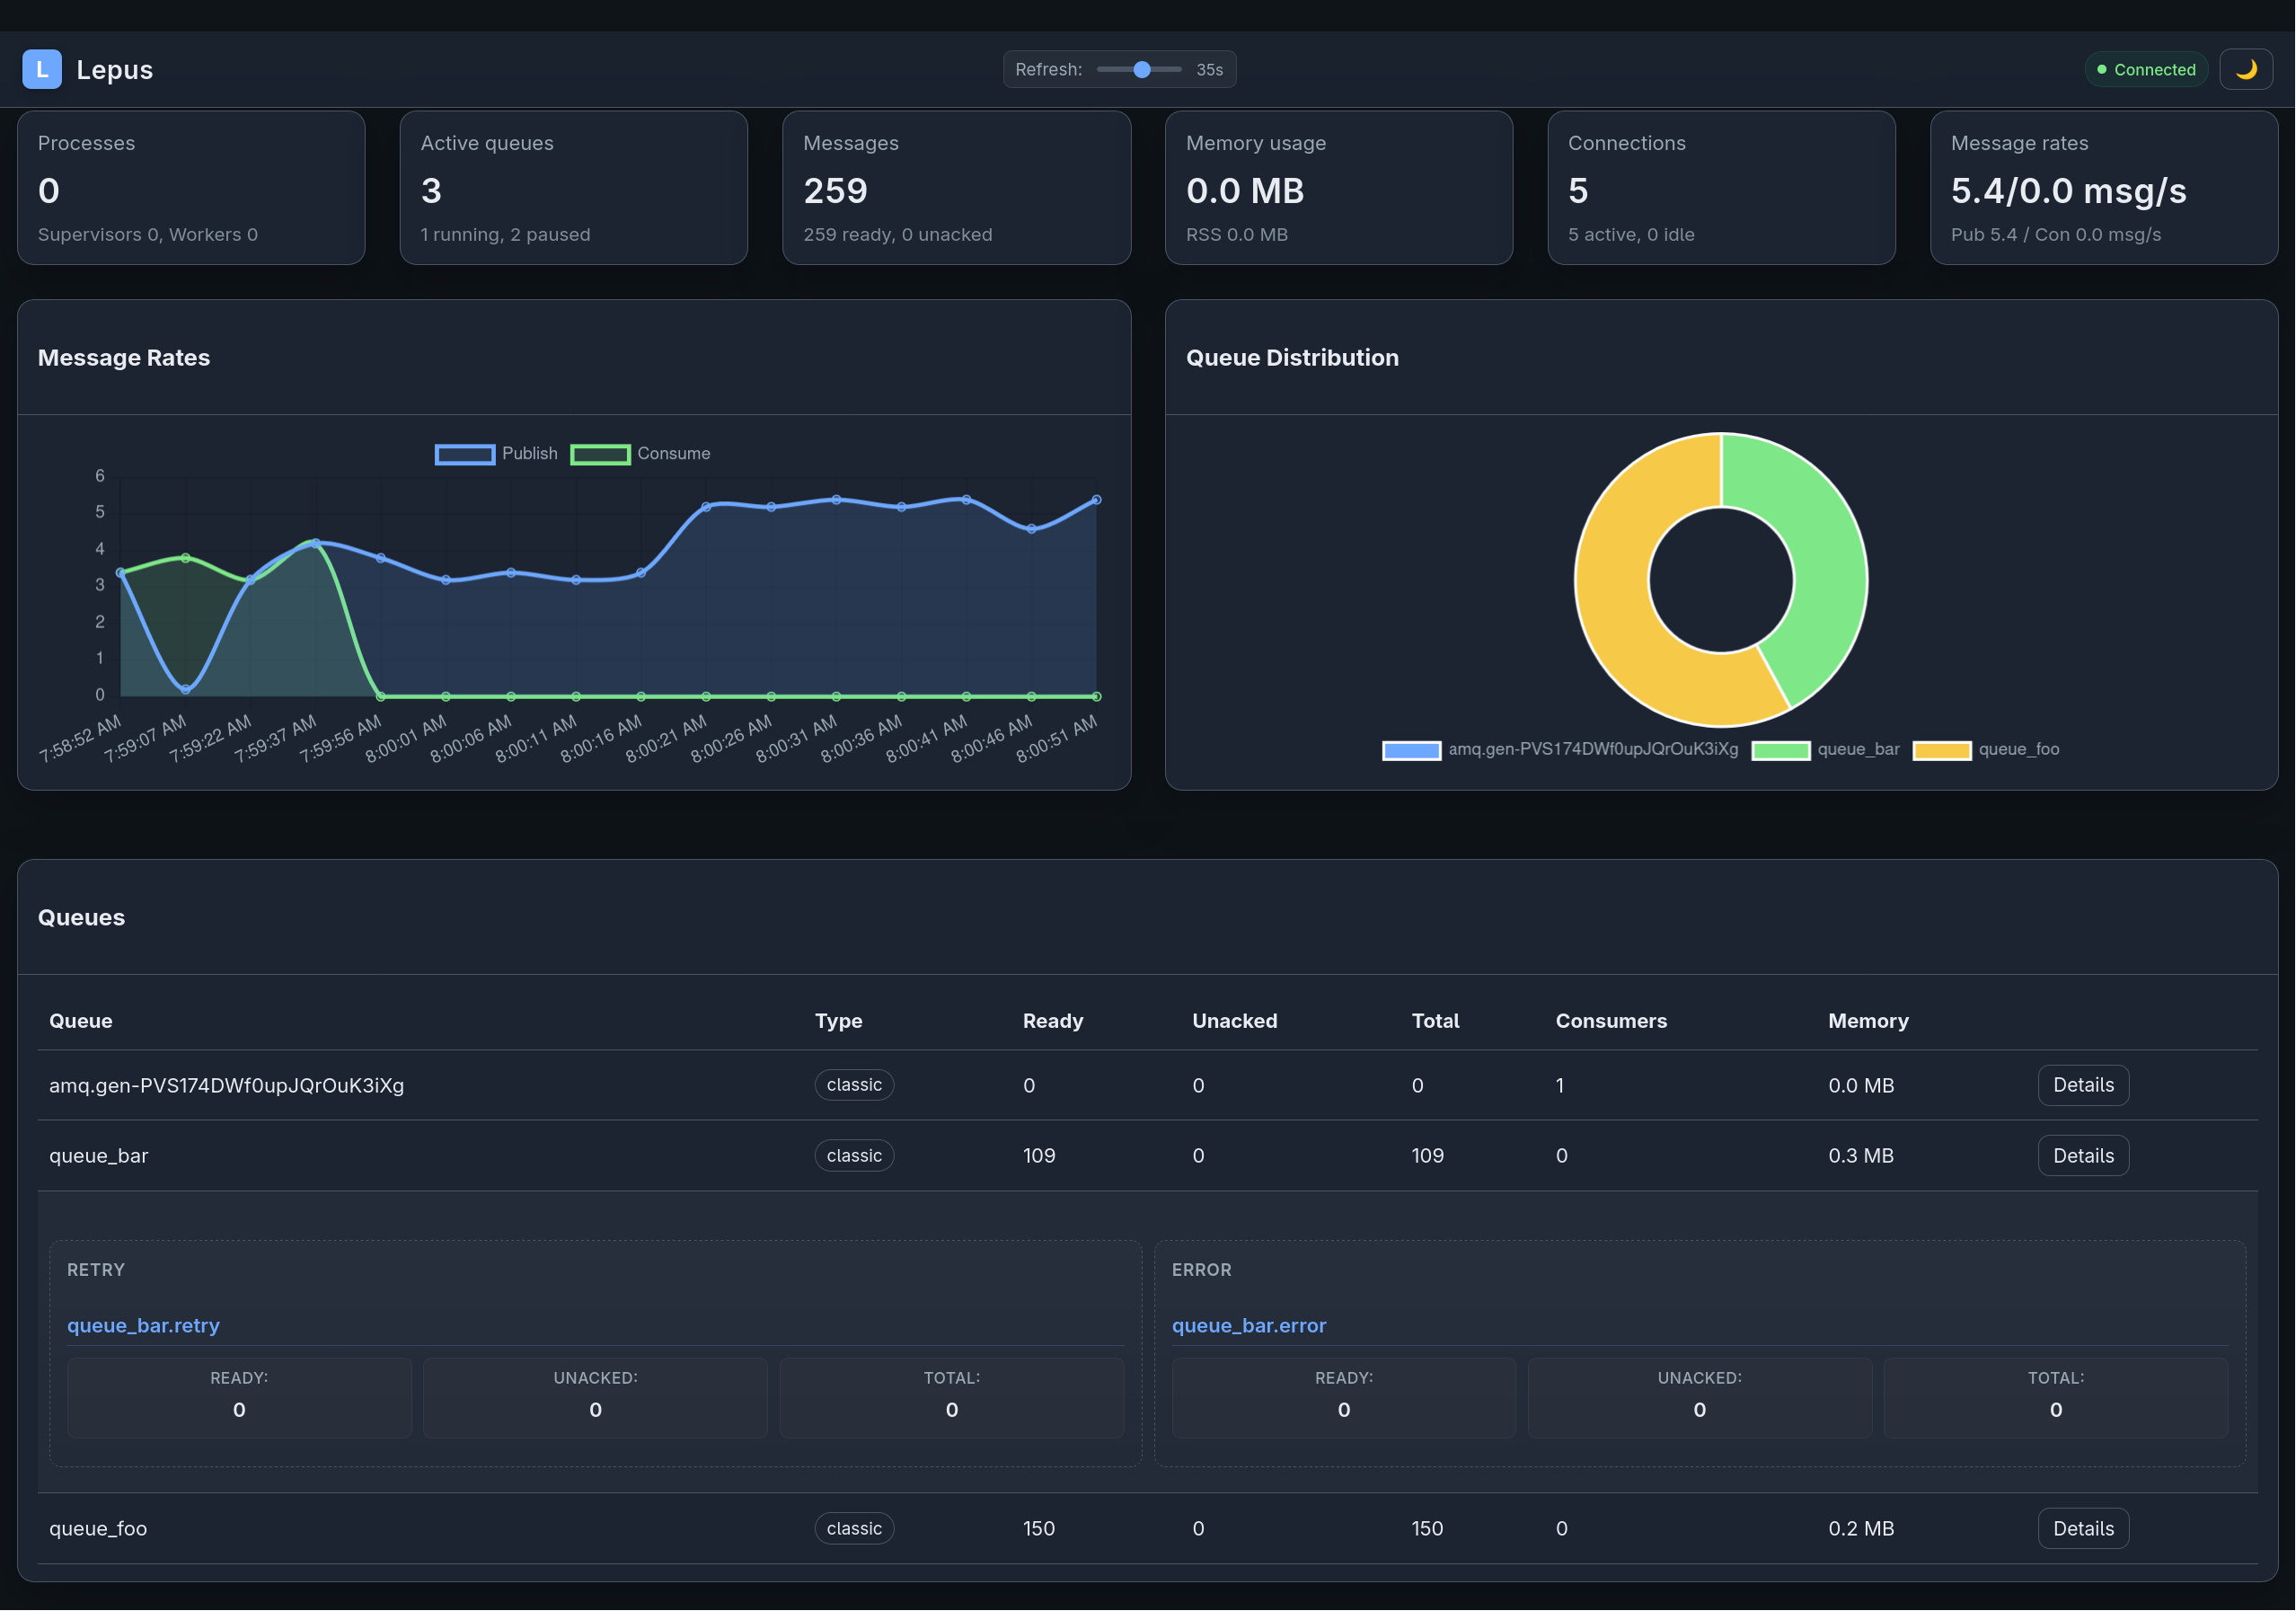
What it shows
- Supervisors. Every running
lepus startprocess. - Workers. Subprocesses per supervisor, with their named pool and PID.
- Consumers. Per-consumer message counts (processed, rejected, errored), queue names, routing keys.
- Exchanges & queues. RabbitMQ topology as seen by the gem.
- Recent activity. Last N messages — timestamps, routing keys, dispositions.
Registry backend
The dashboard reads from the process registry, configured at Lepus.configure:
config.process_registry_backend = :file # single-host# orconfig.process_registry_backend = :rabbitmq # multi-host:file— metadata stored under/tmp/lepus/.... Works out of the box but only for a single host.:rabbitmq— metadata stored in RabbitMQ itself. Multiplelepus startprocesses across multiple hosts show up in one dashboard.
For :rabbitmq, also set:
config.management_api_url = 'http://rabbitmq:15672'Heartbeats
Each worker heartbeats into the registry every config.process_heartbeat_interval (default 60 seconds). Processes are considered “alive” if their last heartbeat is within config.process_alive_threshold (default 5 minutes).
API endpoints
The dashboard exposes a minimal read-only JSON API at /api/... — the UI is a single-page app that consumes it. You can also consume the API directly for custom dashboards or alerting.
Endpoints include (subject to change):
GET /api/processes— all tracked processesGET /api/consumers— all registered consumers with countsGET /api/queues— queue metadata from the RabbitMQ management API (ifmanagement_api_urlis set)
Prometheus metrics
When prometheus_exporter is in your Gemfile and the appropriate middleware is in the chain, Lepus emits counters and histograms for message processing. Point Prometheus at the standard exporter endpoint.
Operating in production
- Put the dashboard behind your existing auth layer (OAuth proxy, Rails authentication, Basic auth).
- Use
:rabbitmqregistry backend for multi-node visibility. - Retain logs separately — the dashboard is for live state, not audit trails.